March 2025 Energy Security Outlook
-
Energy Security Outlook - March 2025.pdf (PDF 2.75 MB)
- The national controlled hydro storage position has continued to decrease since last month's outlook despite a minor uptick in storage, and remains below average at 81% of the historic mean as of 24 March. The rapid decline in hydro storage is largely due to persistently low inflows from the start of the year coincident with low wind generation and planned thermal outages.
- The Electricity Risk Curves (ERCs) for 2025 and 2026 have increased relative to the February update, largely due to a lower gas supply forecast reflecting recent observations, and lower starting coal stockpile and gas storage positions. Meridian's 50 MW Tiwai demand response (DR) contract announced in late February is included in the 2025 modelling. In 2026 the larger Tiwai DR options are included.
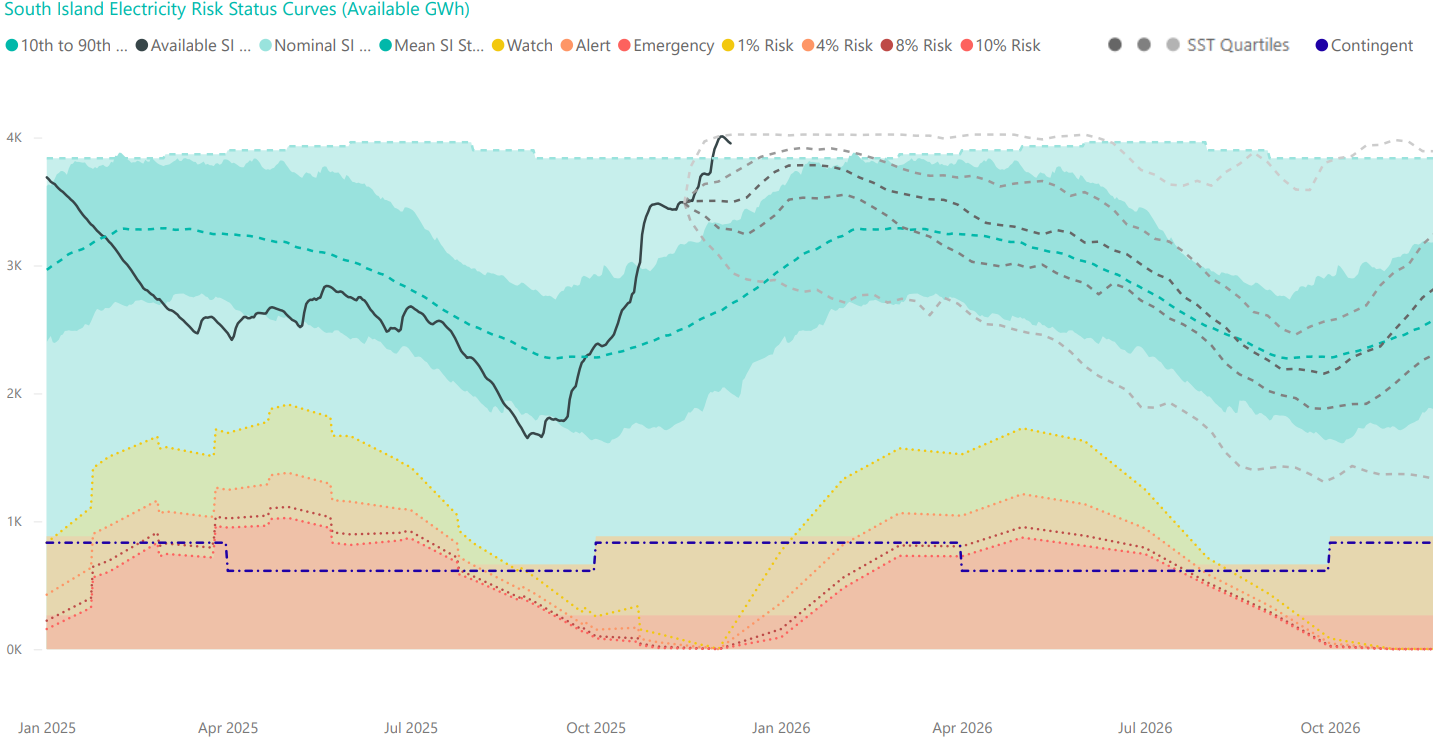
- Two Simulated Storage Trajectory (SST) cross the NZ Watch curve in mid-late April 2025. No SSTs approach the Alert curve or the boundary of contingent storage. This assumes the market supplements the existing coal stockpile and gas available for electricity generation to maintain increased thermal generation during low hydro inflows.
- The ERCs assume the coal stockpile will be replenished at its maximum import capability. Following Genesis announcing additional coal orders on 28 March, the gap between firmly contracted coal and the assumed maximum import capability from April through to the end of October is equivalent to 230 kT of additional orders.
- Consistent with the SOSFIP and indicated operation at Methanex, the ERCs assume Methanex will operate one train at 80 TJ/day. Recent operation has been reported as 50-52 TJ/day with some gas on-sold for generation. There remains potential for generators to contract for remaining Methanex gas.
- The current rainfall outlook continues to indicate normal to dry conditions to prevail for the next five weeks. This highlights the importance of a heightened focus on hydro storage and thermal fuel management ahead of and through winter 2025.
- Increased thermal fuel availability being brought to market by participants' contracting and trading activity can support an increased thermal generation response under extended periods of low inflow. Contracting early can mitigate the potential for the very high prices that occurred in 2024.
The graphs below compare New Zealand and South Island controlled storage to the relevant Electricity Risk Status Curves.
Image

Image
To learn more about the Electricity Risk Curves click here.
Related Files
Energy Security Outlook Data Files
ERC data file.xlsx
(XLSX 13.87 KB)
SST data file.xlsx
(XLSX 1.09 MB)
Assumptions and Update Logs
- Scenarios
-
Reduced Gas Scenario - January 2025.pdf (PDF 3.48 MB)ERC Update Log - Early Tauhara Scenario - April 2024.pdf (PDF 1.66 MB)ERC Update - November 2023 Gas Reallocation.pdf (PDF 1.75 MB)ERC Update - November 2023 Additional Rankine .pdf (PDF 1.75 MB)ERC Gas Reallocation Scenario October 2023.pdf (PDF 1.43 MB)
- Historic Logs
-
Energy Security Outlook - March 2025.pdf (PDF 2.75 MB)Energy Security Outlook - February 2025.pdf (PDF 2.54 MB)Energy Security Outlook - January 2025.pdf (PDF 3.48 MB)Energy Security Outlook - December 2024.pdf (PDF 1.89 MB)ERC and SST Update - November 2024.pdf (PDF 2.07 MB)ERC Update October 2024.pdf (PDF 1.99 MB)ERC Update September 2024.pdf (PDF 1.92 MB)ERC_Update_August_V2_2024.pdf (PDF 1.93 MB)ERC update - August 2024.pdf (PDF 1.9 MB)ERC Update Log - July 2024.pdf (PDF 1.91 MB)ERC Update Log - April 2024.pdf (PDF 2.16 MB)ERC Update Log - March 2024.pdf (PDF 2.71 MB)ERC Update Log - February 2024.pdf (PDF 2.71 MB)ERC update - January 2024 Gas Reallocation.pdf (PDF 1.53 MB)ERC update log - January 2024.pdf (PDF 2.03 MB)ERC Update Log - December 2023.pdf (PDF 2.01 MB)ERC Update Log - November 2023.pdf (PDF 2.06 MB)ERC Update Log - October 2023.pdf (PDF 1.88 MB)ERC Update Log - September 2023.pdf (PDF 1.85 MB)ERC Update Log - August 2023.pdf (PDF 1.88 MB)ERC Update Log - July 2023.pdf (PDF 1.93 MB)